How much of a pay rise you keep
For each salary, the chart shows how much of a £1,000 pay rise reaches take-home pay in 2026/27, as pence kept from each extra £1. It takes off Income Tax and employee National Insurance, and a Plan 2 student loan in the second line. The lowest point is between £100,000 and £125,140, where the Personal Allowance is withdrawn: 38p is kept from each £1, or 29p with a Plan 2 loan.
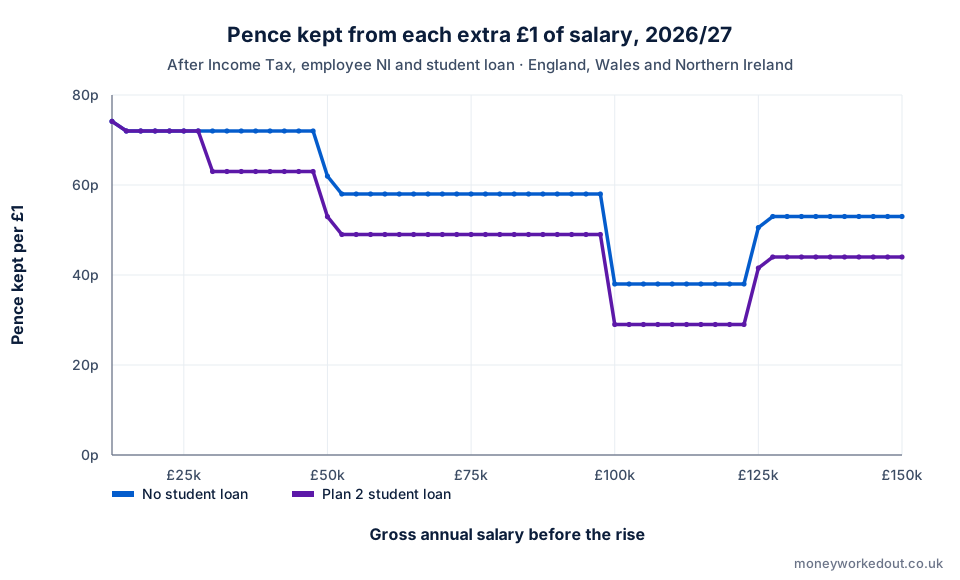
| Salary before the rise | Kept per £1, no loan | Kept per £1, Plan 2 loan |
|---|---|---|
| £20,000 | 72p | 72p |
| £40,000 | 72p | 63p |
| £50,000 | 62p | 53p |
| £60,000 | 58p | 49p |
| £100,000 | 38p | 29p |
| £110,000 | 38p | 29p |
| £130,000 | 53p | 44p |
The figures use the site’s take-home calculator with a standard tax code and no pension. A pension contribution or salary sacrifice changes them, and so does the High Income Child Benefit Charge for anyone who claims Child Benefit and earns over its threshold. The take-home pay calculator works out your own figure, and the 60% band chart explains the lowest point.
Embed this chart
Copy the HTML below. It loads one SVG image and links the chart back to its source page; it adds no script or tracking to your site.
<figure>
  <img src="https://moneyworkedout.co.uk/assets/charts/pay-rise-kept.svg" width="960" height="580" alt="Two lines show the pence kept from each extra £1 of salary from £12,500 to £150,000, with and without a Plan 2 student loan. The lowest point is between £100,000 and £125,140.">
  <figcaption>Chart by <a href="https://moneyworkedout.co.uk/charts/pay-rise-kept/">Money Worked Out</a>.</figcaption>
</figure>
Sources and chart notes
- Income Tax bands: GOV.UK Income Tax rates and Personal Allowances.
- National Insurance and student loan thresholds: GOV.UK rates and thresholds for employers.
- Each point compares take-home pay at the salary and at the salary plus £1,000, so a rise that crosses a threshold shows a blend of the two rates.
The SVG is a static image. It contains no script, tracker or external image request.