House price to earnings by area
The SVG compares the eight lowest and eight highest published local-authority house-price-to-earnings ratios. Each ratio divides average house price by median full-time annual gross pay by place of residence. House prices are from the July 2026 UK HPI file; Northern Ireland uses its latest quarterly result. Pay is for 2025.
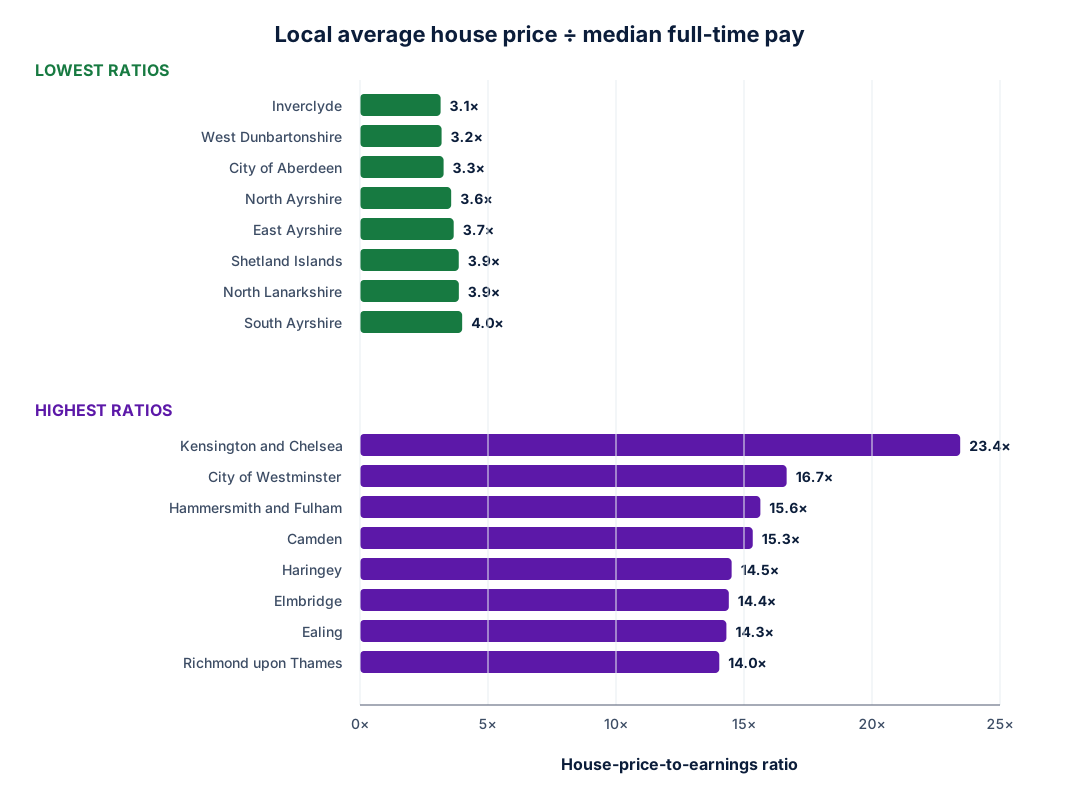
| Group | Local authority | Average house price | Median full-time pay | Ratio |
|---|---|---|---|---|
| Lower ratios | Inverclyde | £115,401 | £36,650 | 3.1× |
| Lower ratios | West Dunbartonshire | £127,521 | £40,011 | 3.2× |
| Lower ratios | City of Aberdeen | £130,689 | £40,020 | 3.3× |
| Lower ratios | North Ayrshire | £143,560 | £40,312 | 3.6× |
| Lower ratios | East Ayrshire | £138,971 | £37,968 | 3.7× |
| Lower ratios | Shetland Islands | £179,493 | £46,527 | 3.9× |
| Lower ratios | North Lanarkshire | £158,591 | £41,070 | 3.9× |
| Lower ratios | South Ayrshire | £171,905 | £43,076 | 4.0× |
| Higher ratios | Kensington and Chelsea | £1,232,640 | £52,576 | 23.4× |
| Higher ratios | City of Westminster | £876,788 | £52,610 | 16.7× |
| Higher ratios | Hammersmith and Fulham | £738,048 | £47,192 | 15.6× |
| Higher ratios | Camden | £815,159 | £53,133 | 15.3× |
| Higher ratios | Haringey | £638,690 | £43,995 | 14.5× |
| Higher ratios | Elmbridge | £748,080 | £51,924 | 14.4× |
| Higher ratios | Ealing | £585,216 | £40,889 | 14.3× |
| Higher ratios | Richmond upon Thames | £803,249 | £57,233 | 14.0× |
City of London is omitted because its 2025 pay estimate is marked unreliable. The full local-authority table includes all 360 areas and labels the unavailable value.
Embed this chart
Copy the HTML below. It loads one SVG image and links the chart back to its source page; it adds no script or tracking to your site.
<figure>
  <img src="https://moneyworkedout.co.uk/assets/charts/house-price-to-earnings-by-area.svg" width="1080" height="800" alt="Horizontal bars compare the eight lowest and eight highest local-authority house-price-to-earnings ratios, based on 2026 house prices and 2025 full-time pay.">
  <figcaption>Chart by <a href="https://moneyworkedout.co.uk/charts/house-price-to-earnings-by-area/">Money Worked Out</a>.</figcaption>
</figure>
Sources and chart notes
- House prices: HM Land Registry, UK House Price Index, July 2026.
- England, Scotland and Wales pay: ONS ASHE 2025 provisional, Table 8.7a by place of residence.
- Northern Ireland pay: NISRA ASHE 2025 provisional by local government district of residence.
- ONS prefers the median as a typical-pay measure. Average house price and median pay describe different populations and reference periods; this ratio is not a household affordability test.
The SVG is a static image. It contains no script, tracker or external image request.